Which one do you believe: a Thousand Oaks neighborhood where prices climbed 12.9 percent year over year, or the same neighborhood where prices fell 17.2 percent over roughly that same stretch?
Pull two market reports on Lang Ranch from this year and you'll find both claims, stated with equal confidence, covering nearly the same window. One report had the median at $1,219,500 in February 2026, up 12.9 percent from a year earlier. Redfin's neighborhood data put the median at $1,124,622 as of May 2026, down 17.2 percent year over year. Nobody made an error. Nobody is lying. The contradiction is the point, and it explains something worth understanding before you trust any single number about a specific pocket of Thousand Oaks this year: a neighborhood-level median, in a market this size, is a far shakier thing than the decimal point suggests.
Why the Same Streets Produce Two Different Answers
A citywide median has enough transactions behind it to absorb noise. Thousand Oaks as a whole saw 381 homes sell in July 2026, up from 328 the year before, according to Redfin, which is enough volume that one unusually expensive sale or one distressed one barely moves the number. Narrow the lens to a single named tract like Lang Ranch and the math changes fast. A handful of closings, in either direction, can swing a monthly median by six figures without a single existing home actually changing in value.
The reports disagree because they were built differently. One might reflect three rolling months of closed sales. Another might reflect a single month, or fold condos and townhomes in alongside single-family houses, or happen to catch a run of freshly remodeled listings back to back with a run of dated ones. Lang Ranch did not reprice itself twice in one year. The measuring stick changed underneath it.
This is not unique to Lang Ranch. It's what happens anywhere a recognizable neighborhood name gets treated as if it were one uniform market instead of a small, thin slice of a much larger one.
A Few Miles Away, the Same Problem Wears a Different Face
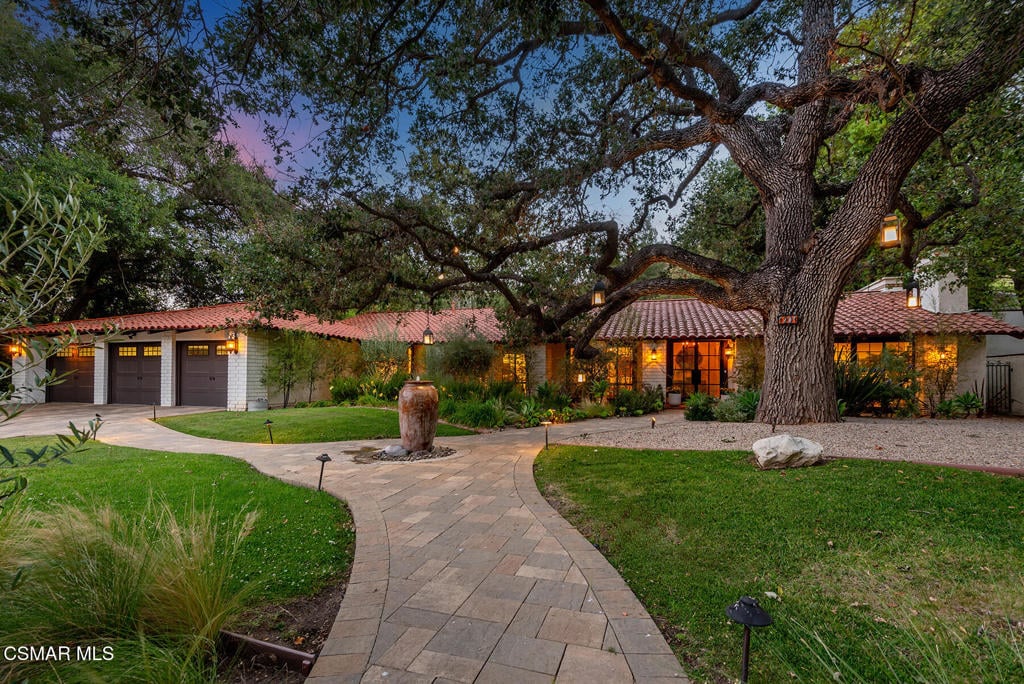
Lynn Ranch, on the southeastern side of the city, shows the same distortion through a different mechanism. Redfin's neighborhood data puts the Lynn Ranch median at $1,598,462 as of May 2026, up 6.6 percent year over year, while current local listing guides describe the range as running as wide as $1.2 million to $2.6 million. That spread isn't measurement noise. It's two different products sharing one label.
Lynn Ranch built its identity on large lots, ranch-style architecture, and a genuine equestrian culture, with more than six miles of bridle trails connecting to the Arroyo Conejo and Conejo Canyons open space preserves. Many of those homes date to the 1970s and 80s, and the ones nobody has touched since sit at one end of the price range. The ones fully remodeled, sometimes gutted to the studs, sit at the other. Two Lynn Ranch listings at nearly identical square footage can be a $1.3 million project house and a $2.4 million finished one. The median doesn't distinguish between them. It just averages two different homes together and reports a number that describes neither particularly well.
The Same City, At Least Four Different Markets
| Submarket | Character | Reported Price Band | What Actually Moves It |
|---|---|---|---|
| Lynn Ranch | Large lots, equestrian trails, mostly 1970s-80s ranch homes | Roughly $1.2M to $2.6M | Renovation condition more than square footage |
| Lang Ranch | Newer construction (1990s onward), highly rated elementary school | Roughly $1.1M to $1.2M, with swings by data source | Small sample size and school-driven demand |
| North Ranch | Country club and golf course estates | Median reported near $1.875M earlier this year | Amenity access and custom estate scale |
| Central Thousand Oaks | Older housing stock, smaller lots, closer to the Ventura Boulevard corridor | Median $854K over the three months ending May 2026 | Higher transaction volume, steadier trend |
| Wildwood / Newbury Park border | Entry-level single-family homes and townhomes | High $700s to low $900s | Affordability relative to the rest of the city |
The pattern across that table matters more than any single row. Central Thousand Oaks, with 37 homes sold in May 2026 alone, produced a comparatively stable trend, down 11.5 percent year over year but consistent with the volume behind it. Lang Ranch, with far fewer closings in a typical month, produced a number that jumped in one direction and then the other depending on who was counting and when.
Lang Ranch's own draw helps explain why buyers are willing to compete for a market this thin. The neighborhood is built around Lang Ranch Elementary, which ranks better than 98 percent of California elementary schools, and homes there tend to move quickly, an average of 25 days on market earlier this year compared with 32 days for North Ranch. Families choosing between the two are often trading North Ranch's country-club scale for Lang Ranch's newer construction and school access, and that tradeoff shows up in the data as genuine, if volatile, demand rather than pure noise.
What This Means If You're Pricing a Home This Fall
If you're selling in Lang Ranch, Lynn Ranch, or any other named Thousand Oaks pocket this season, the citywide median is close to useless for setting your list price. So is a single neighborhood-level report, if you don't know how it was assembled. What actually matters is what closed on your specific street, at your specific size and condition, in the last few months, not a rolling average that may be counting a different mix of homes than the one sitting in your driveway.
For buyers, the same caution runs the other way. If you see a report claiming Lang Ranch prices jumped 13 percent, don't assume every listing carries that premium. If you see the same neighborhood reported down 17 percent, don't assume every seller is under pressure. Both numbers came from real closings. Neither one describes the specific house you're about to write an offer on.
Before trusting any neighborhood median you find this year, it's worth asking a few direct questions:
- How many transactions is this number built from, and over what window?
- Does it include condos and townhomes, or single-family homes only?
- Is it based on closed sales, or on active and pending listings?
- Does it account for renovation status, or only square footage?
A number that can't answer those questions isn't lying to you. It just isn't built to carry the weight buyers and sellers keep putting on it.
Frequently Asked Questions
Why did Lang Ranch show up as both up and down this year? Different reports used different measurement windows and different sales mixes. In a submarket with relatively few closings each month, that's enough to shift the reported median without a single home actually changing in value.
Is North Ranch really the most expensive part of Thousand Oaks? Among the named submarkets in current reporting, North Ranch's country-club and golf-course estates carry one of the highest reported medians, near $1.875 million earlier this year, though fully remodeled Lynn Ranch estates can reach similar territory at the top of their own range.
Does the citywide Thousand Oaks median mean anything at all? It's useful for tracking broad direction, running roughly $1.05 million to $1.1 million depending on the index as of mid-2026, but it can't tell you what a specific street or a specific named neighborhood is doing this month. That requires comparables pulled from the pocket you're actually buying or selling into.
Thousand Oaks isn't behaving like one market this year. It's behaving like several small ones stitched together under a single median, and the ones with the fewest transactions are the ones most likely to hand you a number that doesn't hold up a month later. If you're trying to figure out what your specific street, or a specific neighborhood like Lynn Ranch or Lang Ranch, is actually doing right now, Michelle Price Realty Group pulls comparables property by property rather than relying on a citywide average. Request a Confidential Consultation to talk through what the numbers mean for your particular corner of Thousand Oaks.